

Astronomy Picture of the Day
NASA Release | 13 June 2019
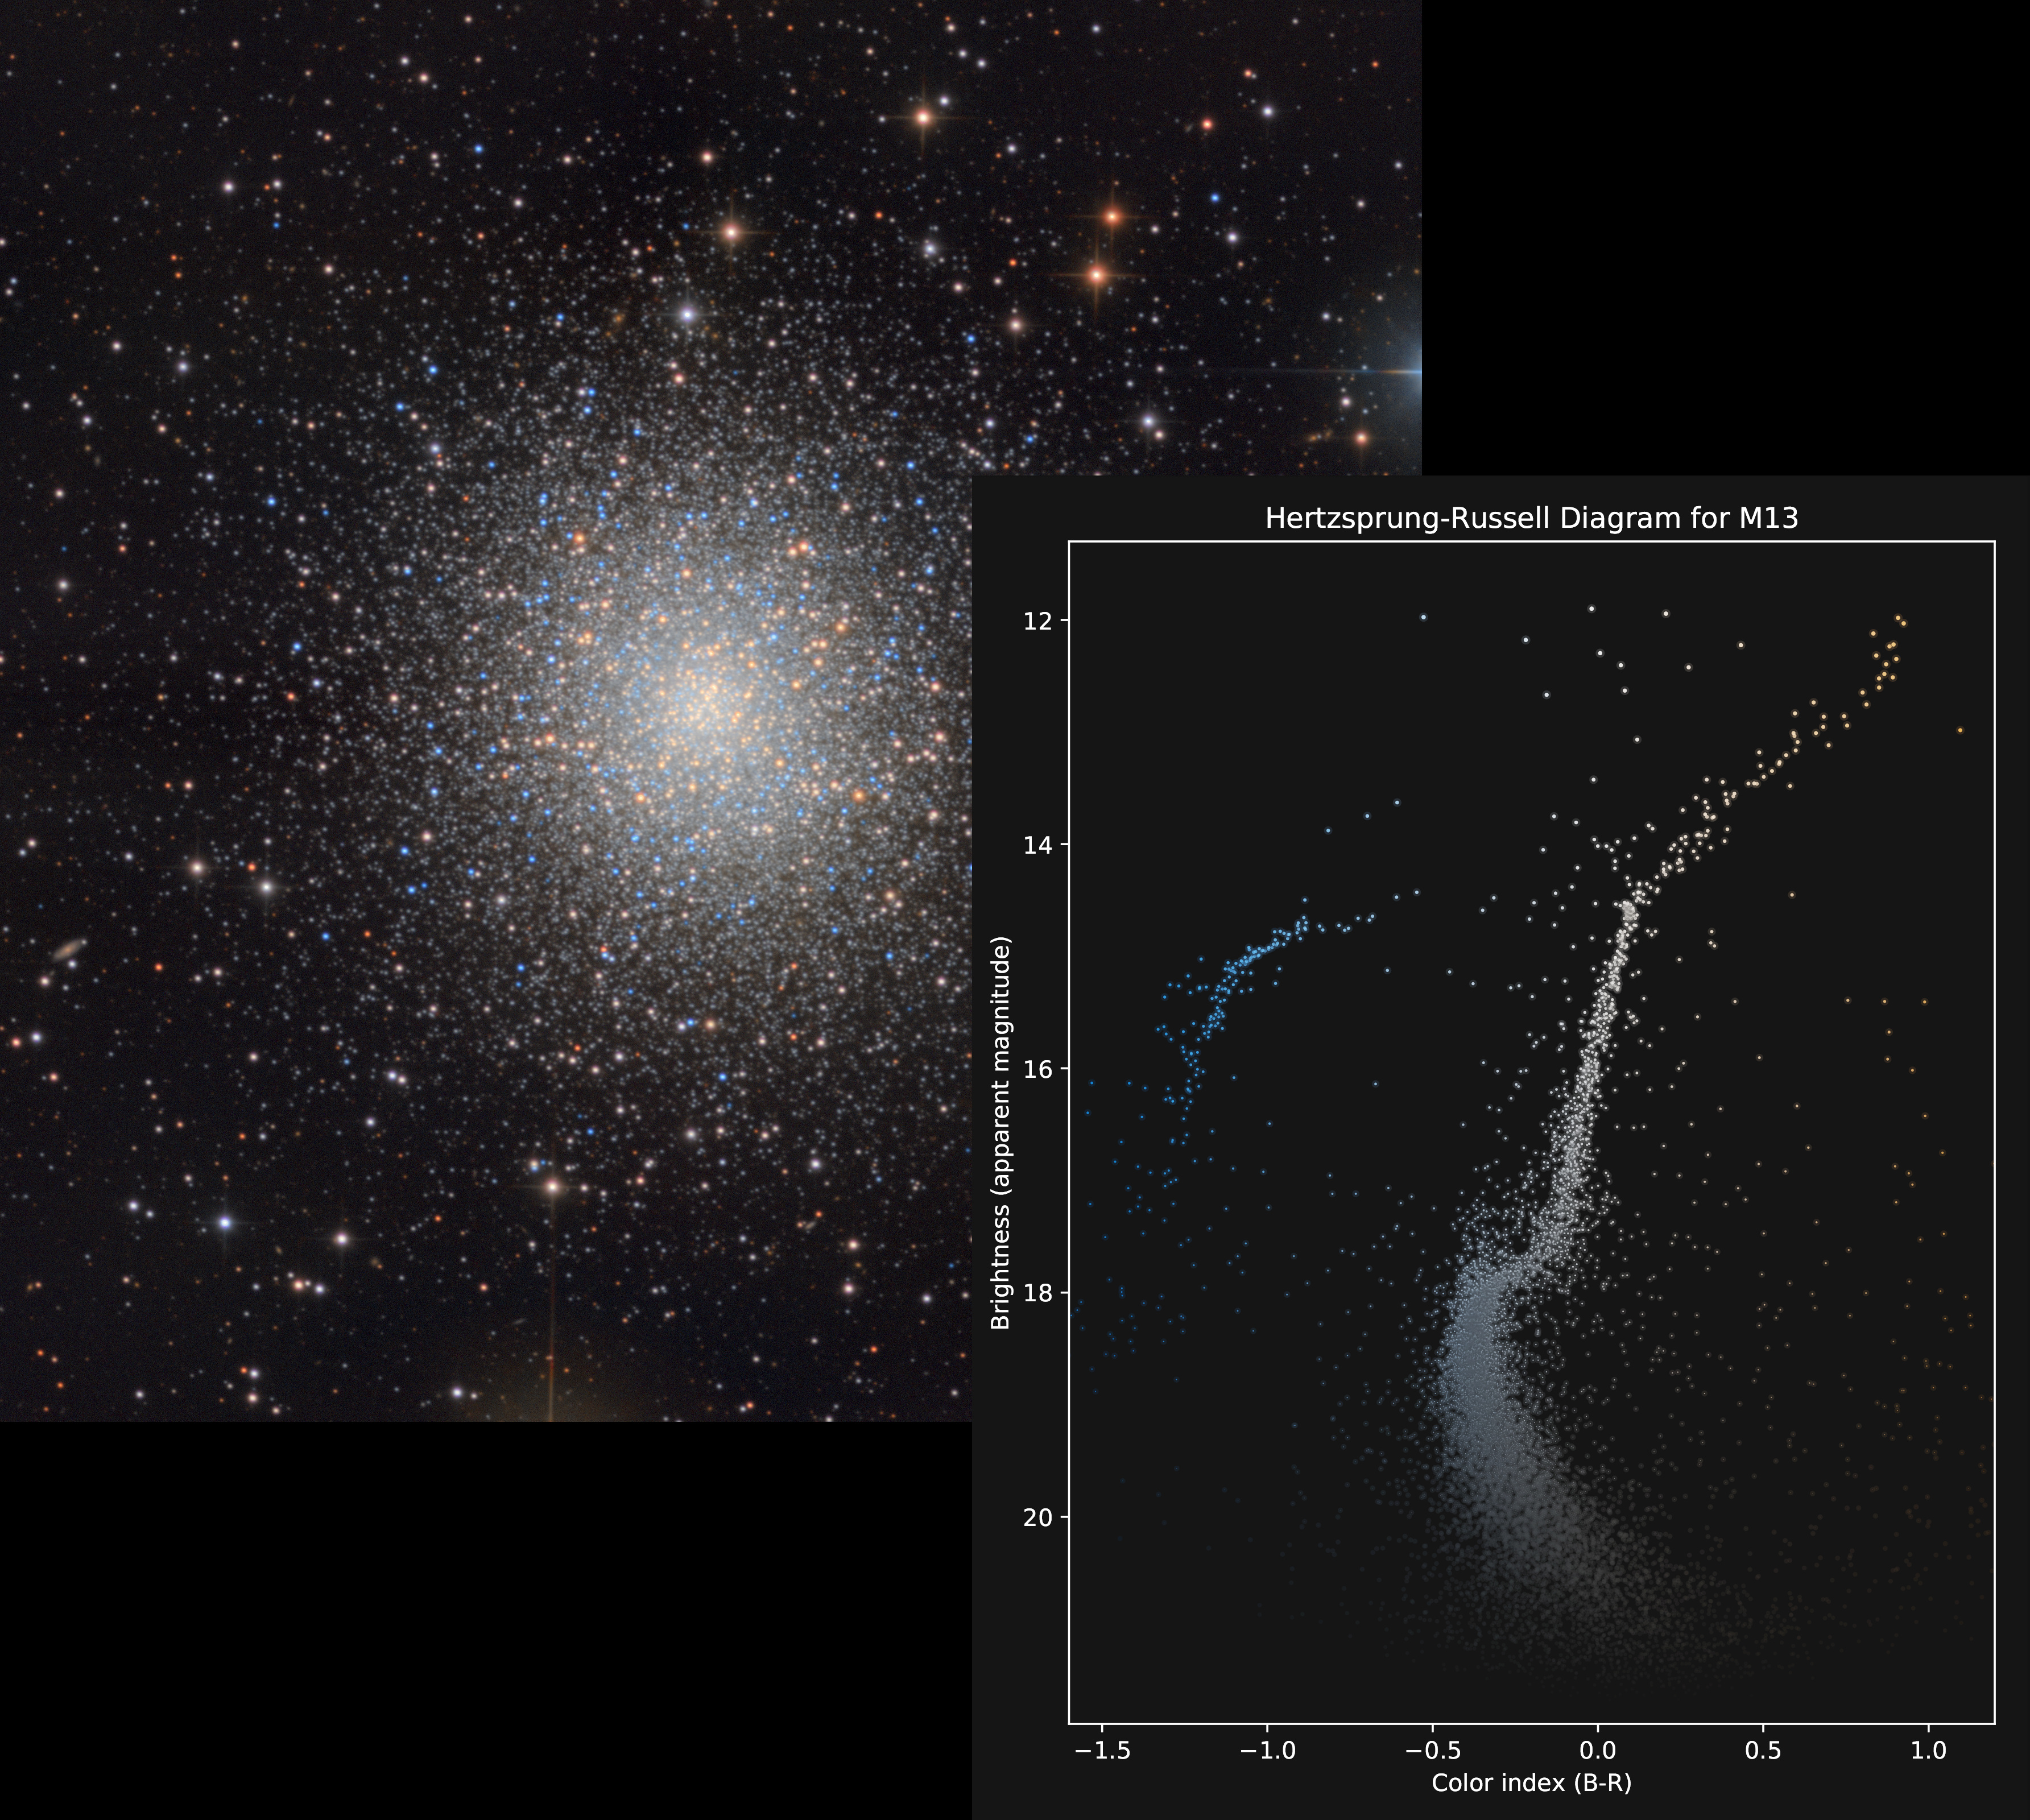
M13 is modestly recognized as the Great Globular Star Cluster in Hercules. A ball of stars numbering in the hundreds of thousands crowded into a region 150 light years across, it lies some 25,000 light-years away. The sharp, color picture of M13 at upper left is familiar to many telescopic imagers. Still, M13's Color vs Magnitude Diagram in the panel below and right, made from the same image data, can offer a more telling view. Also known as a Hertzsprung Russell (HR) diagram it plots the apparent brightness of individual cluster stars against color index. The color index is determined for each star by subtracting its brightness (in magnitudes) measured through a red filter from its brightness measured with a blue filter (B-R). Blue stars are hot and red stars are cool so that astronomical color index ranging from bluer to redder follows the relative stellar temperature scale from left (hot) to right (cool). In M13's HR diagram, the stars clearly fall into distinct groups. The broad swath extending diagonally from the bottom right is the cluster's main sequence. A sharp turn toward the upper right hand corner follows the red giant branch while the blue giants are found grouped in the upper left. Formed at the same time, at first M13's stars were all located along the main sequence by mass, lower mass stars at the lower right. Over time higher mass stars have evolved off the main sequence into red, then blue giants and beyond. In fact, the position of the turn-off from the main sequence to the red giant branch indicates the cluster's age at about 12 billion years.
The Colors and Magnitudes of M13
Image Credit & Copyright: Tolga Gumusayak, Robert Vanderbei
for already registered members

 |
 |
|
|||||||||||
 |
 |
||||||||||||
|
|
|
|
|
|
|
||||||||
 |
|
|
|
|
|
 |
|||||||
|
|
|
|
|||||||||||
|
|
|||||||||||||
|
|
|
|
|
|
|
|
|
|
|
|
|
|
|
Results 1 to 1 of 1
Thread: Picture of the Day: M13
-
06-13-2019, 01:01 PM #1Moderator at Work


- Join Date
- Sep 2015
- Location
- Celestial Fields
- Posts
- 8,641
- Rep Power
- 293
Picture of the Day: M13
Beginner's Guide for Rocket, NFPS and IKS66...
http://iptvtalk.net/showthread.php?2...-you-should-do
Kodi Options for Rocket, NFPS and IKS66...
http://iptvtalk.net/forumdisplay.php?71-Kodi
Check the Announcement Section...
http://iptvtalk.net/forumdisplay.php...-Announcements

 Reply With Quote
Similar Threads
-
EPG but no picture
By guest in forum BuzzTV XRS4900Replies: 6Last Post: 06-11-2023, 08:54 PM -
Picture
By dotsadie in forum Kodi DiscussionReplies: 2Last Post: 05-21-2016, 12:35 PM -
picture!!!
By Marcus1183 in forum Amazon FireStick & FireTVReplies: 14Last Post: 05-16-2016, 03:10 PM -
How do I take a picture of my box' MAC?
By 1sikmf in forum IPTV Private Server (NFPS)Replies: 5Last Post: 04-13-2016, 04:07 AM -
Picture?
By dropbows in forum IPTV STB EmulatorsReplies: 1Last Post: 03-04-2016, 01:33 AM
